

I’m a lifelong believer that baseball nerds care too much about numbers. No, it doesn’t matter to me what happens 62% of the time when a fastball is thrown on a Tuesday. No, I’m not impressed by your nephew’s interest in launch angle. Okay cool, your spin rate is up 12 rpm, what does that mean for my daily intake of 1-4 professional sporting events? “Ultimate Zone Rating” sounds too much like a lasertag term to be a real stat, bro; please drink some water.
Analytics have absolutely changed this game for both the better and worse. Front offices have radically altered their approach to roster construction (firing long-time scouts and using AI) as well as in-game management (calling pitches from upstairs), all thanks to the numbers their dweeb-departments pull together.
I tend to lean towards ‘no thank you’ on this stuff because I’ve lived the Moneyball of it all first-hand. Some of my favorite guys’ careers have been left to rust due to all the platoonage that comes from computers giving managers match-ups, rather than letting someone play through a lull and actually improve. Plus, not all athletes’ brains are built for data. Giving players so much intel makes them over-think at the plate, and swing at garbage.
Those of you here for my occasional baseballosophies know I lead with nonsense but at the root, I’m a GAMER. I know a bad route when I see one (Tyler Soderstrom, I am looking and talking about you). I can pick up a minuscule change in batting stance from a prior AB, and will annoy anyone sitting with me talking about how much weight someone has shifted into which foot [I have been named a lower-half-ologist in my online social circles and wear it proudly]. I love noticing hyper-specific patterns in-game, but for some reason when those things are listed in a chart with a stupid abbreviation, my mind goes “Ew, that’s not baseball.”
There are a few I tolerate, beyond the hundred-year-old basics such as batting average:
WAR (Wins Above Replacement) I get. That makes sense to my brain, and it feels like a valuable way to arrange talent [no I will not get into the difference between fWAR and bWAR. Go google it with your grandma]. Dude A is more productive when in a game, and beneficial to the team winning than Dude B. Cool. Fine.
Exit Velocity is fun. You can feel the variation in how hard something comes off the bat from your seat, even if it’s your couch. There is a sound, a power, an energy that comes from >100mph rather than something tapped back into the field of play weakly. Respect it.
WHIP (Walks/ Hits per Inning Pitched) is maybe my favorite thing to check on a rival pitcher. It’s clear as day. There’s no lengthy equation. How often are pitchers allowing baserunners? Important. Got it.
DRS (Defensive Runs Saved) clears this old-school mind also. I can easily visualize and comprehend that less opponent runs can score when Player X is on the field rather than his bench-riding teammate at the same position. It’s in the name. Clear, concise. Runs are Saved. Great.
But where my mind goes “Hell to the no, to the no-no-no” is when I see these wild abbreviations with +’s and x’s and some letters capitalized and others not. I love a chart but some of these heat maps and other data spreads are too much for my luddite brain to compute, and I’m no dummy - This old lady passed AP Calculus at one point in time! I actually self-identify as someone who likes math! Just when it comes to sport, it does feel like we’ve gone too far.
So, in honor of the 3,000 year old heroic journey of Odysseus being in theaters, I too decided to take a trek through some of these SABRmetric seas, and stop at a few islands to see if I learned anything worthy of taking home to my lovely and devastated family. I am not hopeful, but I am resilient, resourceful, and occasionally brought to life by Matt Damon. Allons-y.
Stat: wOBA
MLB.com Description: “Weighted On-Base Average is calculated by multiplying each positive offensive event by an empirical run-scoring weight, adding those values together, and dividing by the player’s total plate appearances (excluding intentional walks)”

Layman’s Terms: How often are you getting on base, and how many bases you tend to get. A good wOBA will look like a good OBP (on base percentage), around .350 and up, but will also take into account how MANY bases you tally rather than just getting on.
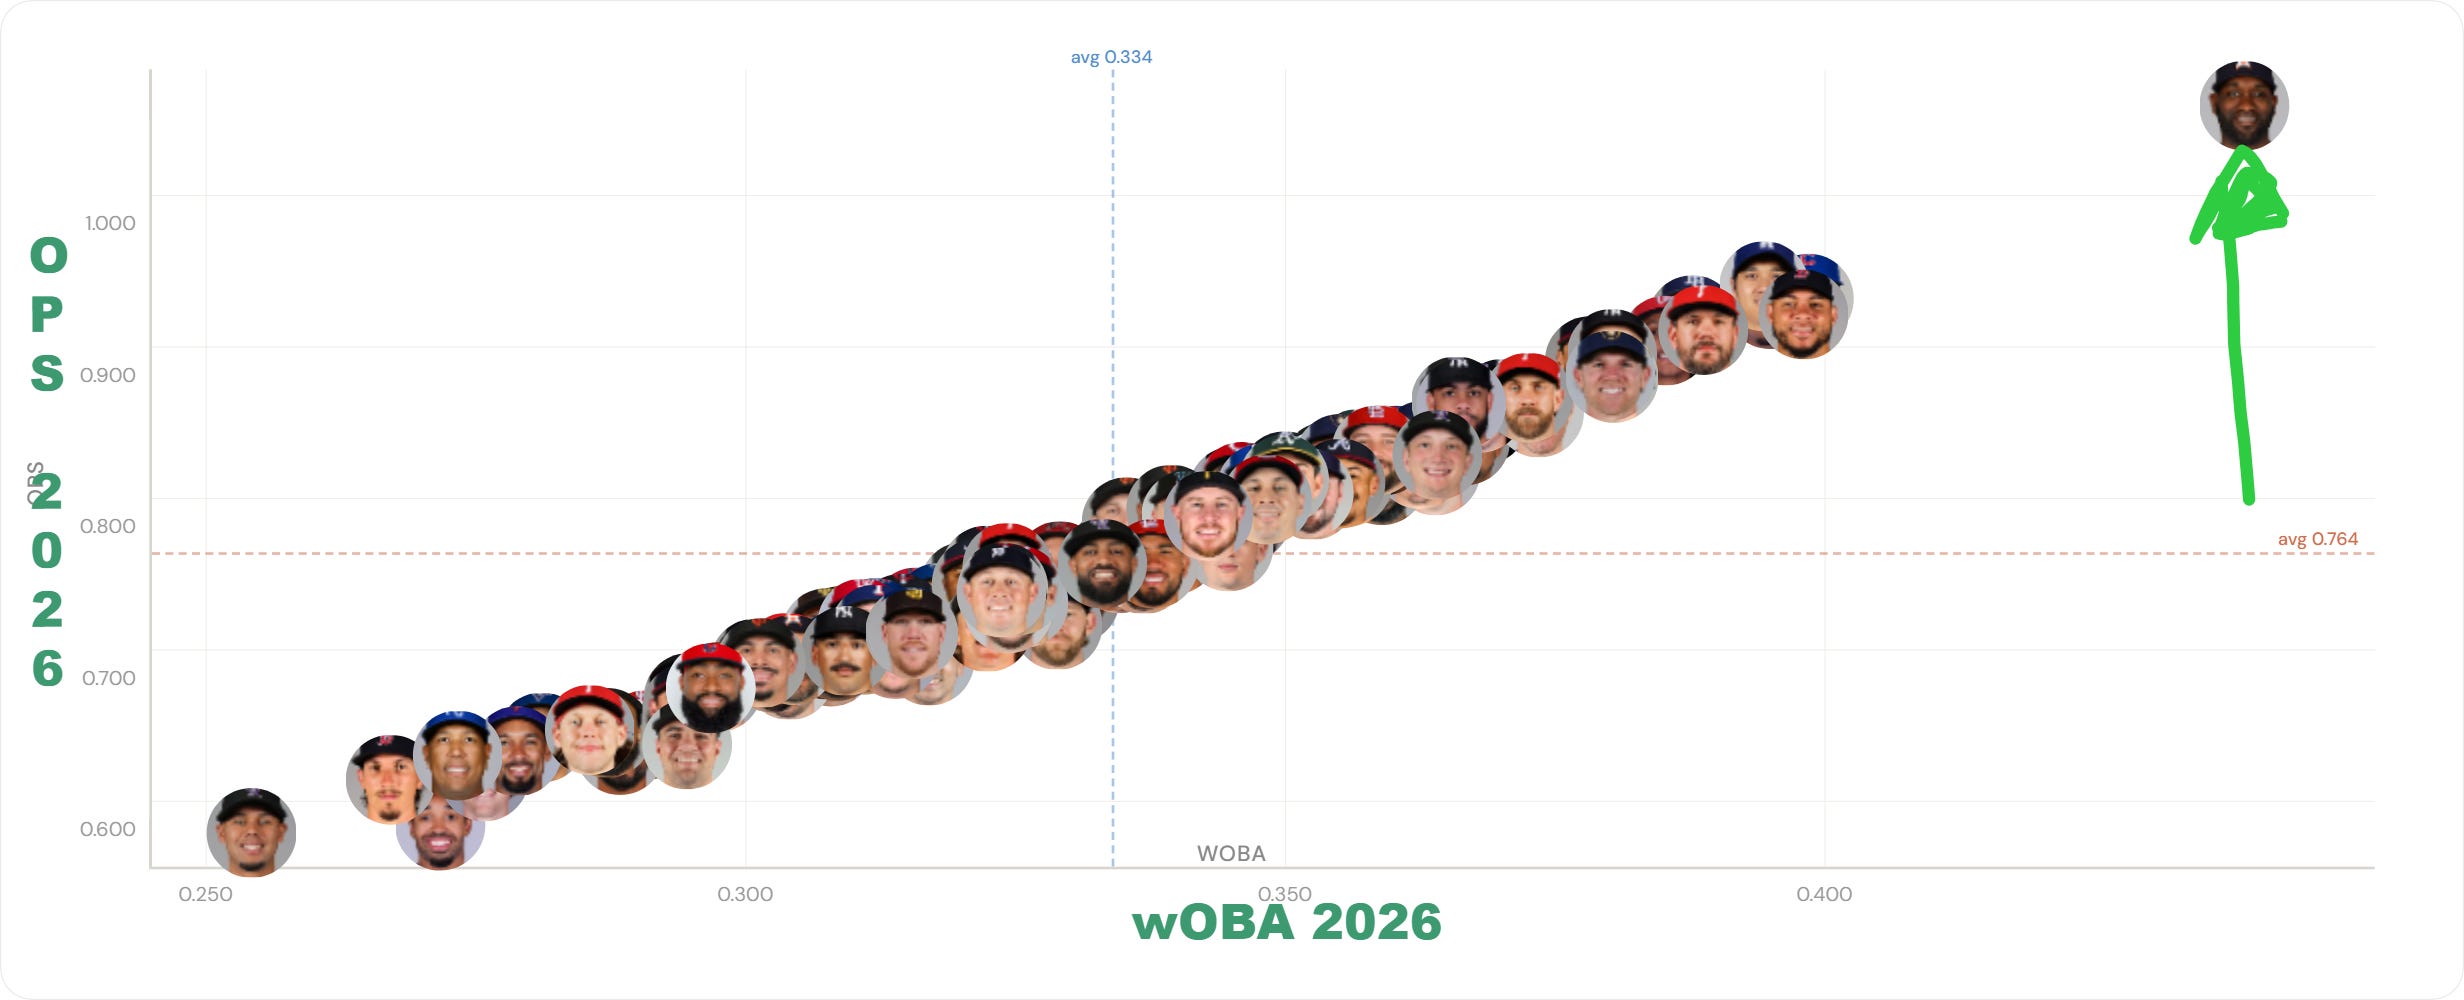
For visual context, here is a current look at the league’s OPS laid against wOBA. As we talked about, anything over .350 is good, and you can see the two stats trend the same (hence the vertical upward through line). But Yordán breaks crazy ahead of the pack in part because his wOBA is weighted heavier by homers, otherwise his little face would be half an inch to the left.
Do we Care? I’m gonna say yeah, I think so. OBP, OPS, and wOBA give pretty similar outputs, but wOBA is a lil’ more accurate because it shows the contribution of hitting for extra-base hits with more emphasis. Also… it’s fun to say “Whoa-ba.”
Stat: wRC+
FanGraphs Description: “Weighted Runs Created Plus; wRC+ is a stat that measures a hitter’s overall offensive value compared to league average. It takes all of a hitter’s contributions at the plate and translates that to his impact on runs created for his team.

wRC+ attempts to credit the hitter for the appropriate value of each outcome of a plate appearance i.e. a home run is worth more than a single […] and also accounts for important external factors, like ballpark or era.
A wRC+ of 100 means a league-average hitter, and a wRC+ of 150 means a hitter is 50% better than league average. Every point of wRC+ above or below 100 is equal to one percentage point above or below average.”
Layman’s Terms: wRC (sans +) is “Player A was worth 24 runs to his team last year,” and the + gives it context to the league average. So if the same Player A has a 124 wRC+, it means he produces runs 24% better than the average MLBer, and Player B’s punk-ass having a 70 wRC+ would mean he is 30% worse.
Do we Care? I actually really like this. Now that I know what it is, it has meaning to me in a way that’s interesting and comparable for thinking about my favorite players and their ability to produce runs (and ultimately wins for their team). It also doesn’t feel TOO hocus-pocus-y, because it’s rooted in actual produced things (wOBA and contextual factors like the specific stadium they are in) and not some expected nonsense based on a flight simulator some nerd developed in their computer lab.
Stat: FIP
MLB.com Description: Fielding Independent Pitching
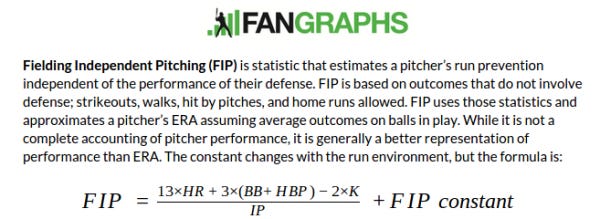
Layman’s Terms: It’s a pitcher stat that relies solely on things a pitcher can control: strikeouts, walks, HBPs, and HRs. It entirely removes results on balls hit into the field of play, aka - if your guy was backed by the “league average fielders,” how well is he mitigating run-scorage?
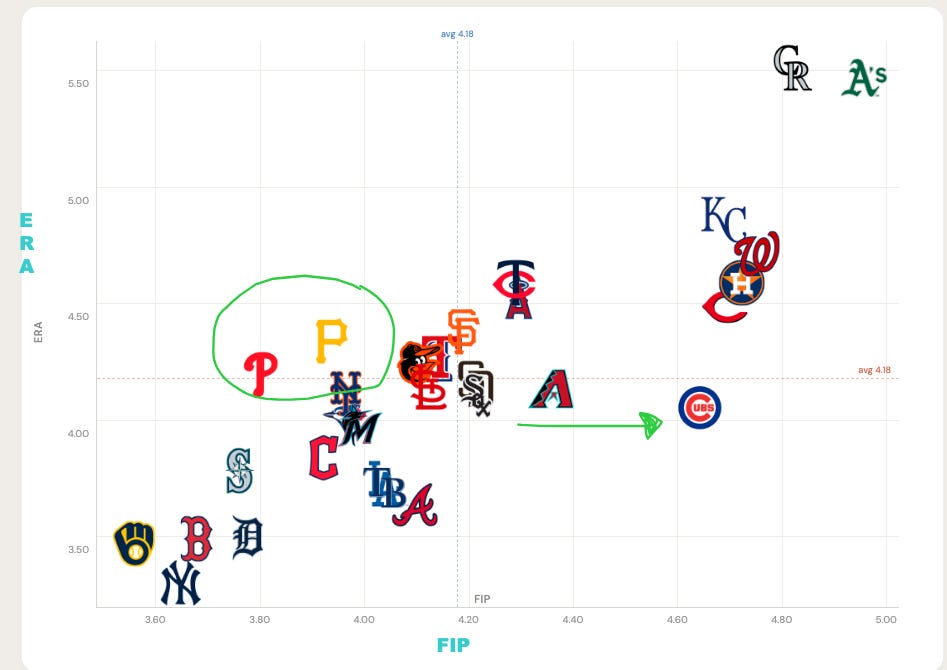
As you can see in the graphic above, the pitching at Wrigley has been bad regardless of defense (high FIP, avg ERA), whereas Pittsburgh and Philly are having worse than average ERA’s and better than average FIP which means… they need to hire Ron Washington. Comprende?
Do we Care? I may be a softy for saying this, but I have always felt that a pitcher’s win-loss record is pretty unfair and not their doing, almost at all. Is that because I’m used to watching games where the team provides no run support during an outstanding pitching performance? Maybe. Who hasn’t seen a generational talent on the mound giving up easy ground balls that don’t get fielded well by his 22-year-old shortstop? It’s trash and unavoidable, but in any event it does happen. And I do believe in isolating a pitcher’s value with things that are his fault/success.
As I said up top, I like WHIP as a snapshot of how good or bad a pitcher is, and I can see how this is kinda WHIPpy. Once I comfortably learn the scale of what a good FIP would be off the cuff (this year it stands as anything under 4), I could see checking this one again. Sure.
Stat: xBACON (for fun. Come on; I had to)
Description : xBACON literally stands for Expected Batting Average on CONtact.
Layman’s Terms: What will a player’s batting average likely be when they are able to make contact - exactly what it said, duh. But also it asks “Is this guy going to be productive with his swings in that he is timing them well, and avoiding hitting to a standard defender’s position?” It should be called How Much Like Tony Gwynn Is This Dude [But abbreviates are hard and even Don Draper couldn’t sell HMLTGiTD. Hence BACON].
Do we Care? There are so many factors when you hit a ball: how hard you hit it, where the defenders are, what the pitch was doing… My stat-friendly pal Anthony, when asked if we should care about this, said:

xBACON to me is just BABIP with a better PR team. BABIP (Batting Average on Balls in Play) has been around forever, and is really the same thing without home runs included.
AND I truly don’t believe in expected stats. Baseball is not a computer program. It’s a human sport. It’s quite literally dangerous to sell data that tells fans what a guy SHOULD hit. Things happen. It’s a sport full of superstition but somehow we’re supposed to act like bad luck or streaks can’t happen? I’d like to see the statistical analysis of how often expected analytics directly leads to threatening DMs about fantasy bets gone wrong. Add it up: Players put pressure x expectations on themselves + media questions + asshole coaches + front offices threatening to demote + society’s growing gambling addiction = YIKES+.
Throughout this piece, I used Will Harris (friend of the blog)’s Scatter Tool to create graphics to better showcase what I meant. And even though I rag him relentlessly for being a nerd who doesn’t actually know baseball, but rather is a slut for numbers, I did find that playing around visually with some of this stuff did help me recognize its value.
I don’t see myself going full excel sheet. Do not invite me to participate in your fantasy baseball team (I draft with my heart and then feel DOUBLE bad when my faves under-perform). I will probably never cite these stats at you all again here on this platform, so there’s no need to plan for a quiz, however, I do see how, to maybe a different type of brain, this stuff is helpful for understanding baseball. But numbers can always be manipulated, and you can pick and choose a stat to back up whatever kooky argument you’re trying to make.
Sports are kind of a Rorschach test. Some people see quantifiable data and a reason to weigh their emotional or financial investment. Some people see the insane science at play that is spurred by the ability and agility of the human body. Some people see poetry, romance, a soap opera played out over 162 games.
I try and soak in all of the above, but still lean mostly into the magic over the numbers. The beauty in sport for me is on the playing surface, not the Statcast Dashboard. Sorry, dweebs.
Fortunately, while I still have eyes and a soul, I’ll participate in baseball the old school way, cherrypicking which kinds of stats supplement my personal viewership to better suit my narrative for which players I like and which I inherently don’t. And I’ll grumpily shoo off the new calculations I don’t understand as being “for you young people.” At least until I get powerful enough to make up my own stats, in which case, watch out.
I’m at the age when all this stuff makes my head hurt. I just want to sit back and enjoy the game. BTW “platoonage” is a word I’ve never seen before ;>)
Most fans, including myself, don't really need to know analytics, outside of WAR. We're not talent evaluators for a front office, a hardcore baseball blog, or even a serious fantasy league. The simpler stats might not tell the entire story but they do a decent enough job showing who's doing well and who isn't.
WAR, WRC+, FIP... that probably does the heavy lifting for us.
Also with analytics, it's always changing. The metrics that were cutting age in 2011 and 2019 is old hat now. It's tough to keep up. And really, the teams/league have proprietary stats and tools that we don't even know about, so it feels like we're outside the loop as is.